
SHORT ANSWER
When social views fall, identify the posts behind the change before deciding what to make next. Follow four steps to compare performance, investigate possible explanations, plan a specific content task and review the results. A worked tutorial example shows useful task fields, consistent review windows and what to do when records are incomplete.

Article
Move from social media data to action in four steps: observe the change, form a hypothesis, draft a task, and review the result. Find the accounts and posts behind the change, then decide what to try, who will do it, and when to compare results. Keep the observed data, possible explanations, and proposed actions distinct.
This workflow suits teams that already have account and post records and want to plan their next content batch. If you first need to retrieve those records, start with natural-language social data queries. Define the scope, time, metrics, and comparison before moving into diagnosis.
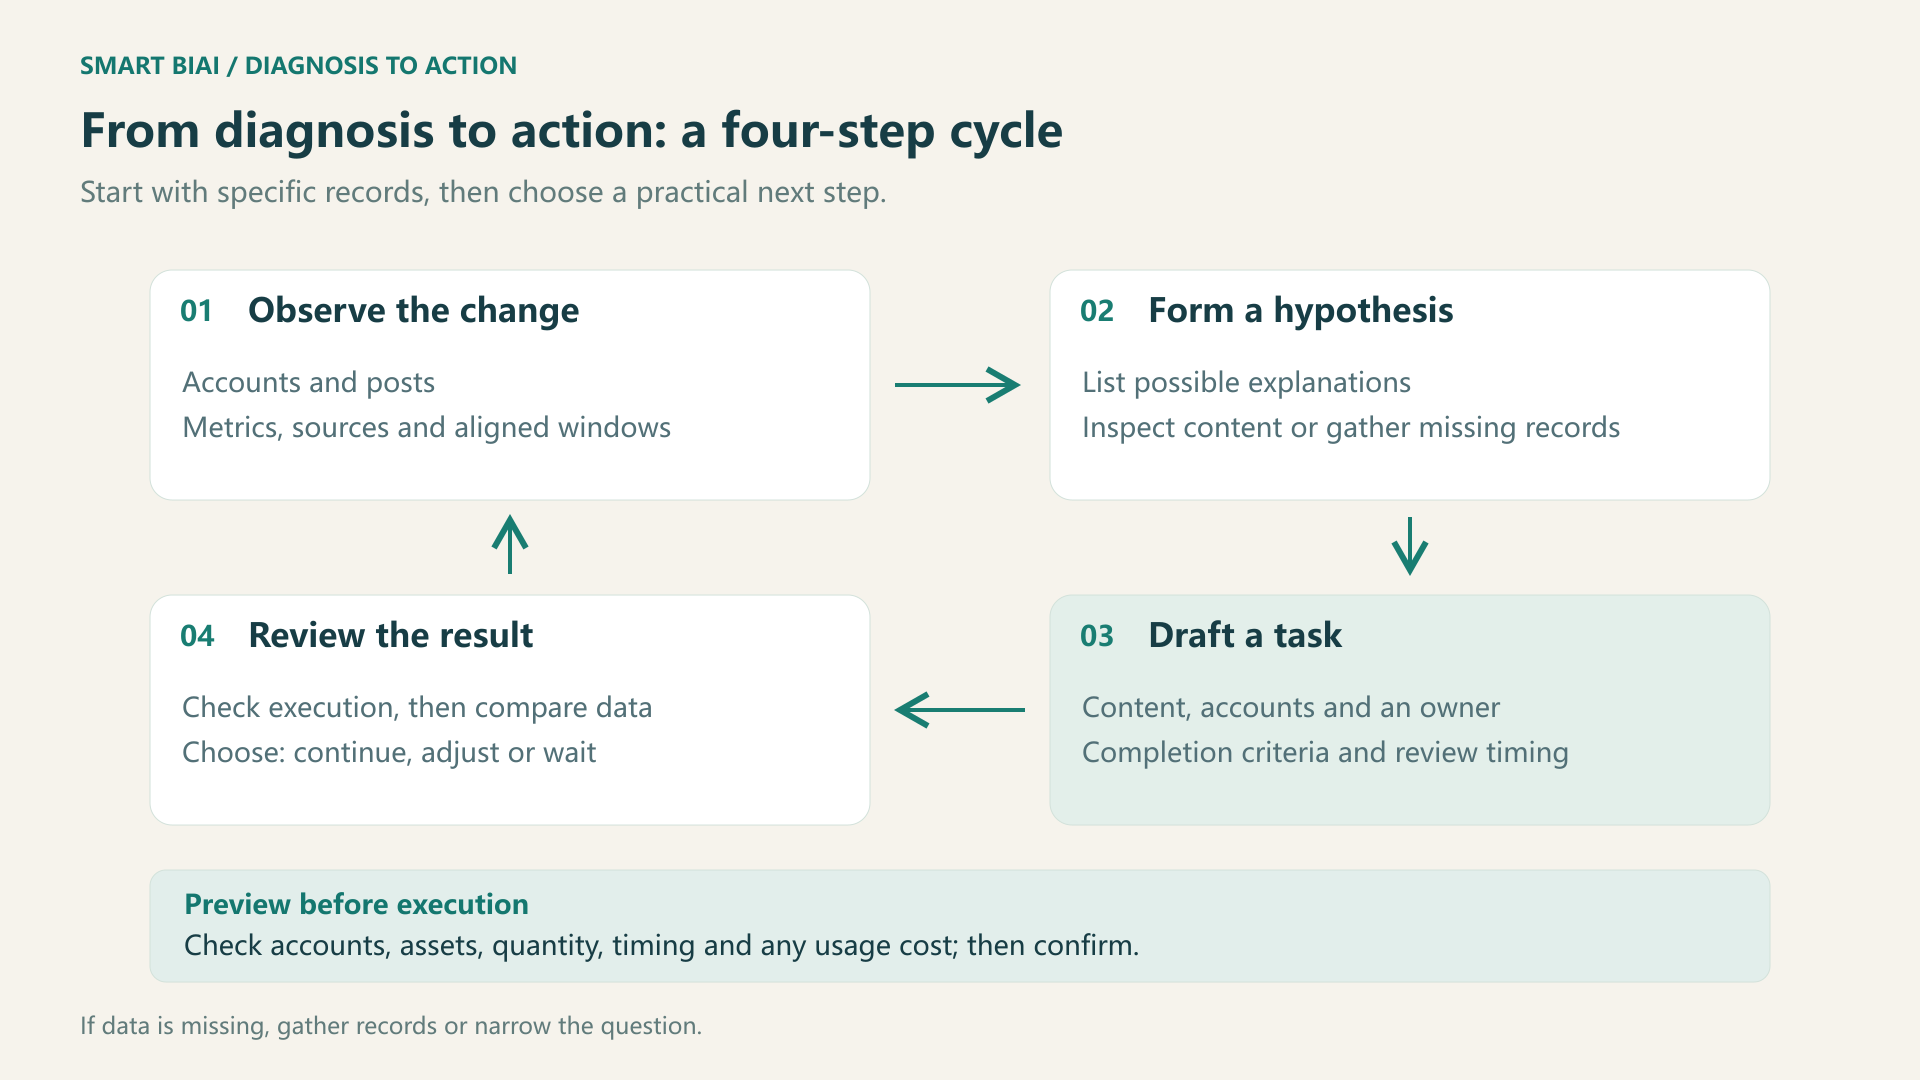
1. What does each step resolve?
A report shows what happened. A diagnosis goes further: what deserves investigation, and what should the next batch try? A decline in views describes a change. Preparing two openings for the same product, keeping the main content similar, and comparing the results describes a next action.
| Step | Question to answer | Information for the next step |
|---|---|---|
| 1. Observe the change | Which platform, accounts, or posts changed, and on which metric? | Comparable values, post links, observation times, and sources |
| 2. Form a hypothesis | What might explain the change, and how can it be checked? | Content-specific explanations and the records still needed |
| 3. Draft a task | What should change, who will do it, and what counts as complete? | Content requirements, selected accounts, an owner, and completion criteria |
| 4. Review the result | What should be observed after the change, and when? | Review timing, metrics, and a decision to continue or adjust |
When data is incomplete, start by watching a few videos, checking subtitles, or confirming publishing status. Those checks may be more useful than producing another batch immediately.
2. Example: views fell by 30%. Should the team publish more?
This fictional example compares two batches of six product tutorials on the same platform for the same target market. Each post is observed 72 hours after publication, with public status confirmed and the relevant data synced. Comparing at that point requires records from the corresponding times. The observation length can be adjusted to suit the content cycle.
| Metric | Previous six posts | Current six posts |
|---|---|---|
| Views | 12,000 | 8,400 |
| Likes | 240 | 210 |
| Comments | 36 | 42 |
| Shares | 24 | 42 |
| Listed interactions combined | 300 | 294 |
| Listed interactions divided by views | 2.5% | 3.5% |
Views changed by (8,400 - 12,000) / 12,000 = -30%. The listed interactions fell from 300 to 294, a decline of 2%. The example interaction-to-view rate rose from 2.5% to 3.5%, an increase of one percentage point, not a 1% increase.
This example calculates engagement as (likes + comments + shares) / views. Check the formula and reporting scope before comparing it with another report. Interaction counts, unique people, and inquiry conversion rates describe different outcomes.
These numbers show fewer views. They do not establish that the content failed overall or that publishing more would fix the decline. Look at which posts account for the change, whether their openings explain the product's use promptly, whether they address the same audience, and whether their publishing arrangements differ. Read the comments and examine the content behind the changes in sharing.
For cross-platform definitions and available detail, see the global social data guide. If observation lengths differ, describe the difference before ranking new posts against content that has accumulated weeks of results.
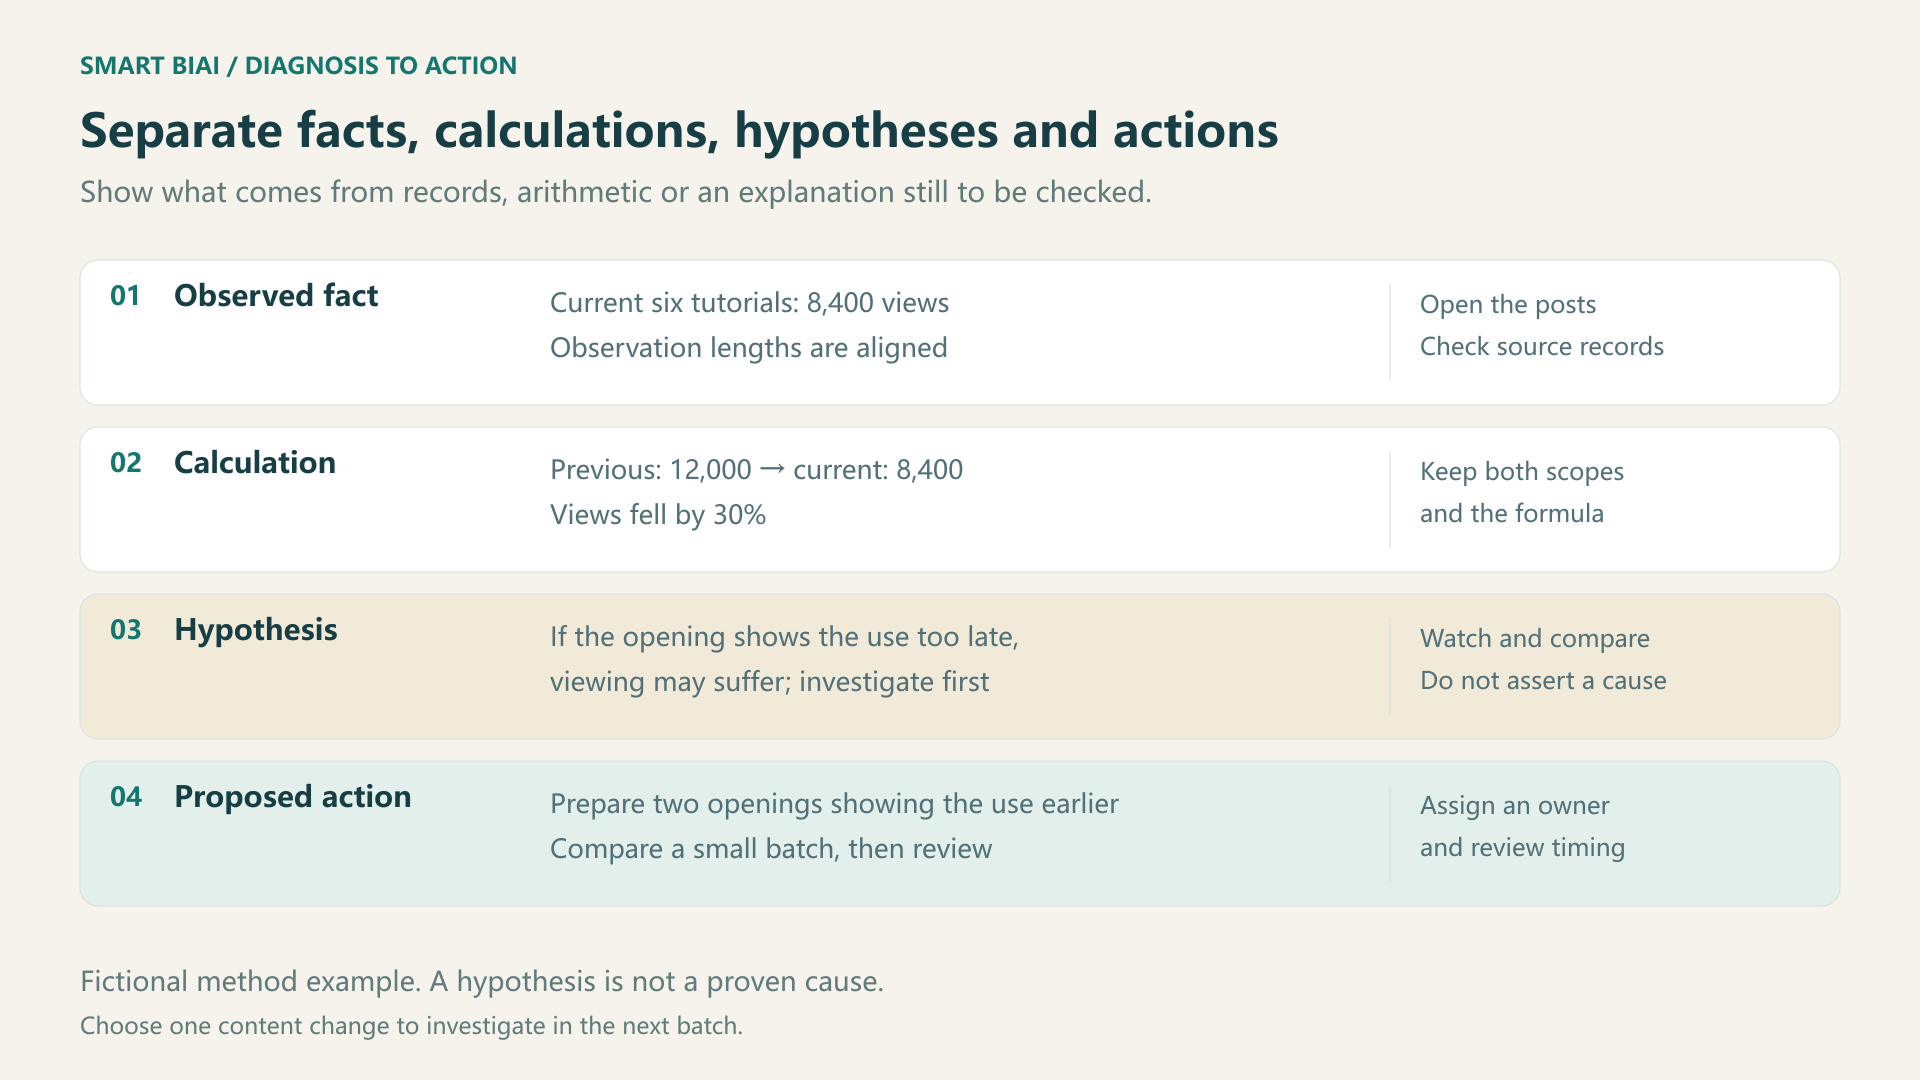
3. How should facts, calculations, hypotheses, and advice be written?
Start with the data change, examine the posts for possible explanations, and choose one adjustment to try. Separating these layers makes the findings easier to discuss and compare later.
| Layer | Example wording | What to inspect next |
|---|---|---|
| Observed fact | The current six tutorials received 8,400 views within aligned observation windows | The posts and their source records |
| Calculation | Views fell by 30% from the previous batch's 12,000 | Both scopes, the formula, and the included posts |
| Hypothesis | If the openings take too long to show the product's use, viewers may not see its relevance promptly | Watch the videos and compare similar openings with different results |
| Proposed action | Prepare two openings that show the use earlier, then compare a small batch | Selected assets, task requirements, and review metrics |
To investigate the opening, watch what it shows and when the product's use becomes clear. Use that inspection and a later comparison to decide whether to change the approach.
4. How do you make the next task clear?
Turn “improve the content” into specific videos, accounts, quantities, and timing so that creators and operators know what to do. The example below plans two openings for product tutorials.
| Item | Example requirement |
|---|---|
| Question to investigate | Is showing the product's use earlier worth continuing in tutorial content? |
| Content and audience | One product and target market; select the publishing accounts from those already authorized |
| Deliverables | Three comparable tutorials for each of two openings; keep the main content, language, duration, and aspect ratio as similar as practical |
| Owner | Assign a content owner and ask someone familiar with the product to check key statements |
| Deadline | Agree on a delivery date before the planned publishing cycle |
| Completion criteria | Six checked videos, with files, covers, titles, and selected accounts matched |
| Before publishing | Use the task preview to check finished videos, accounts, quantity, timing, and credit usage |
| Review timing | Check each post at 72 hours; summarize after the final post reaches 72 hours |
| Outcomes to inspect | Views, the listed interactions, comment content, and actual publishing results, with post links |
If assets are limited, start with one sample. Check the opening and product presentation before extending the approach to other versions.
Creators can deliver finished videos first. Operators can then select the accounts, copy, and timing before scheduling and publishing.
5. Why check a preview after AI has proposed an action?
Alongside performance data, consider current promotions, stock, asset usage rights, and brand messaging. That context helps the team choose a useful action.
Before generating video, check the assets, model or processing options, version count, and credit budget. Before publishing, check the accounts, finished videos, copy, timing, and platform settings. Make any changes before starting the task.
Smart BIAI Agent can help organize the analysis, recommendations, and task draft. Once an approach is selected, prepare the assets and accounts, inspect the task preview, and confirm generation or publishing.
6. How do you decide whether to continue, adjust, or wait?
Before comparing performance, check which posts are public on the selected accounts, whether they use the right videos, and when the data was updated. Add posts that are still processing once their status is clear.
| What the review finds | A practical next step |
|---|---|
| Target metrics and content feedback improve over aligned observation windows | Keep the approach and observe it in subsequent comparable content |
| Views and interactions move in different directions | Return to the posts and business objective: more viewing, useful conversation, or website visits |
| A clear language, visual, or product explanation problem appears | Fix that specific issue before another comparison |
| Publishing is incomplete, the window is too short, or records are missing | Check the status or wait for data before judging content performance |
A small, non-random content comparison can help select a direction. It cannot establish causation on its own. Changing language, music, audience, and publishing time together makes attribution harder. Prioritize one clear change per round and record other differences.
Website visits and inquiries require links with source information and on-site analytics. More social views do not imply the same proportional increase in inquiries.
7. How can you ask Smart BIAI Agent to move from diagnosis to action?
Smart BIAI Agent can use company information, authorized social data, content assets, and task records to assist with queries, analysis, and task drafts. A focused question makes the answer easier to use.
For example: “Review the selected tutorials for the German market. List comparable posts, observation times, and changes in views and interactions. Separate observed changes from possible explanations. Suggest one small content adjustment, then list the assets needed, the owner to assign, completion criteria, and a review arrangement.”
Comparing performance at 72 hours requires records from that point. If only current cumulative counts are available, choose posts of similar ages and state the comparison scope.
Start with one market, one group of authorized accounts, and one concrete question. Inspect the posts and data cited in the diagnosis before choosing an action. See the social data analysis and diagnostics scenario for a related workflow.
8. When should the team gather information before changing content?
Identify whether the next step needs more data, a publishing-status check, or additional content information. Addressing the right issue first can save rework.
| Current situation | A better first step |
|---|---|
| A newly connected account has no comparison period | Collect sufficient records or focus on posts with usable history |
| A metric is unavailable or the latest sync is incomplete | Check the connection, available fields, and update time; do not fill gaps with zero |
| A task is processing and public status is uncertain | Inspect the platform post and task result to avoid duplicate publishing |
| Product information, local-language wording, or asset usage is unclear | Get the relevant information before choosing a production approach |
Plan the next step with your team
To turn existing records into a practical content plan, request an enterprise consultation. Describe the platforms, account scale, and question you want to resolve.
Questions enterprise teams ask
How do AI social media diagnostics differ from a report?
A report presents values, scope, and trends. Diagnostics use those records to propose explanations worth checking and practical next tasks. The explanations still need inspection of the content and subsequent observation.
How can a decline in views become an actionable task?
Identify the posts and observation scope, then propose one specific change, such as showing a product's use earlier. Specify the content to create, its owner, completion criteria, and the timing of the comparison.
Why do AI recommendations still need a person's confirmation?
Analysis may lack the latest product, campaign, or asset information. Before execution, check the actual accounts, content, timing, and possible usage cost, then choose an action that fits the business situation.
What should a diagnostic result contain?
Include the question, accounts or posts, observation time, metrics and sources, specific changes, hypotheses, proposed actions, and a review arrangement. For calculations, retain the formula and input values.
How can the team judge whether the next action worked?
Confirm that the posts are public, then compare similar observation lengths using the same formula. Consider comments and business feedback alongside the metrics. Use small-batch results to choose a direction and check it in subsequent content.
Can diagnostics proceed when a metric is missing?
Start with the available records and list the missing metrics. Retrieve them or choose another metric as needed.
How often should results be reviewed?
Choose timing around the content cycle and data updates. This article uses 72 hours after publication as an example. Allow longer for content needing longer-term feedback, then compare once the relevant data has updated.