SHORT ANSWER
To review TikTok, YouTube, Instagram, and Facebook together, enterprises should align the object, period, source, and refresh time before comparing shared metrics with platform-specific metrics. Smart BIAI synchronizes available data through official APIs within the user's authorization scope.
Why similarly named metrics should not simply be added together
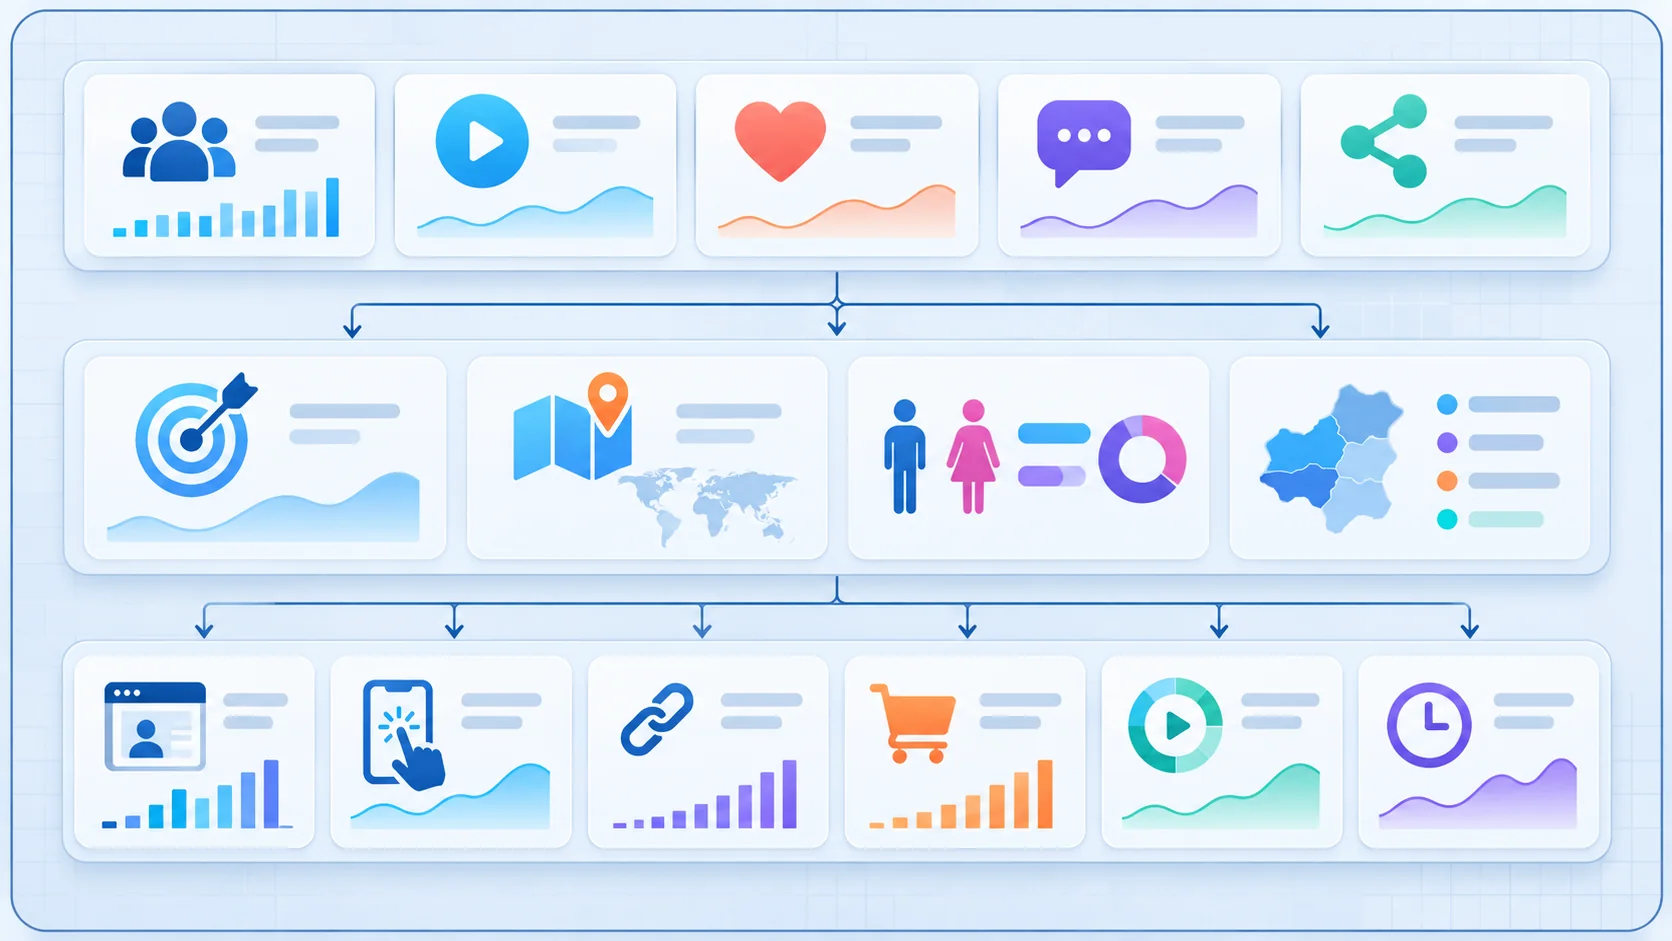
TikTok, YouTube, Instagram, and Facebook all provide follower, view, and engagement data, but similar names do not guarantee identical definitions. Before combining global social media data, clarify five things: whether the metric belongs to an account or a piece of content, whether the reporting periods match, which platform supplied it, when it was last synchronized, and how that platform defines it. A useful cross-platform report has two layers. The first shows common metrics such as followers, views, likes, comments, and shares to reveal portfolio scale and trends. The second preserves platform-specific fields—for example TikTok profile views, app downloads, website clicks, GMV, completion rate, and average watch time—to answer more specific operational questions. Smart BIAI obtains data through official platform APIs. After the user authorizes an account, the system synchronizes the fields available within that authorization. Missing permissions or unavailable API fields are not replaced with estimates.
1. Put common metrics in one viewing framework
Smart BIAI currently uses followers, views, likes, comments, and shares as common cross-platform metrics. They can be shown side by side, but each result should retain its platform, account, content item, and date range. Follower totals describe account scale but do not represent deduplicated people across accounts. Views show consumption volume, while each platform may count a view differently; same-platform trends are usually the safest first comparison. Likes, comments, and shares help explain engagement changes but do not by themselves demonstrate purchase intent or business conversion. The purpose of common metrics is a consistent entry point, not to erase platform differences. If a weekly report shows higher total views, continue to identify the platform, accounts, content, and dates that produced the change.
2. Keep platform-specific metrics separate
Within the corresponding TikTok authorization scope, Smart BIAI currently supports profile views, app downloads, website clicks, GMV, completion rate, and average watch time. Profile visits, app downloads, and website clicks are closer to subsequent user actions. Completion rate and average watch time describe viewing depth. GMV represents transaction data only where the relevant account and data permissions are available. These fields should not be converted into assumed equivalents on another platform or filled with estimates when authorization is absent. Whether a field appears depends on the account type, granted data scope, and actual API response. A unified report can share navigation and time filters while preserving the source field so “not available” is not mistaken for zero.
3. Separate viewers from followers
People who watched content are not necessarily account followers. Smart BIAI keeps these audiences separate: video-viewer data can include traffic source and geography, while follower data can include gender and regional distribution. Viewer data helps answer where a group of content actually reached people. Follower data describes the audience accumulated by the account. A difference between the two is a signal to investigate language, publishing time, topic, tags, or distribution—not proof that the content is good or bad.
4. Use portfolio, account, and content reports for different questions
A portfolio overview answers what changed overall. Account and content reports locate where the change occurred. The overview can show account count, followers, views, likes, comments, and shares over a selected date range. Account-level data can include country, default language, time zone, follower scale, content volume, and period changes. Filters by platform, group, and account help identify outliers. Content-level reports connect metrics to a specific video or image post, publishing time, and public link. Within the relevant TikTok authorization scope, the report can also include profile views, app downloads, website clicks, completion rate, and average watch time. A practical workflow is to spot a trend in the overview, locate the accounts responsible, and then inspect the content and publishing context. This produces a more actionable answer than one total number.
5. Use a documented time zone and refresh schedule
Smart BIAI currently reports by Beijing time and supports daily account- and content-level queries and trends. When evaluating local publishing time, also check the account time zone and actual publishing timestamp. Content data uses a tiered synchronization schedule: content published today is refreshed every 30 minutes, content from the past three days every hour, content from the past seven days every three hours, and older content once a day. This schedule does not mean every platform produces or returns data at exactly the same time. API latency, authorization status, and field availability can affect what is visible. Before comparing periods, confirm that both ranges have completed the relevant synchronization cycle.

6. Preserve dates, dimensions, and source fields in exports
Smart BIAI supports exports for publishing logs and data details, account-level statistics for the past 30 days, content-level statistics for the past 30 days, and custom-dimension statistics. Current exports use Excel formats such as .xls or .xlsx. Publishing records can include country, account group, account tag, account, publishing type, content link, Beijing and local publishing times, metrics, and status. Custom statistics can use date, country, platform, account group, account tag, and video tag dimensions, with metrics such as total or new content, views, shares, and likes. The selected dimension determines the question a report answers. Country shows markets, platform shows channel mix, account groups or tags support organizational analysis, and video tags compare themes or asset types. Keep the chosen date range in exported files so the reporting context is not lost.
7. Turn reports into operational questions
The next step after aggregation is to rewrite changes as questions: which platform contributed most of the view change, which accounts changed in both publishing volume and new followers, which video tags gained more shares, whether completion changes coincide with duration or publishing time, and whether viewer geography differs from follower geography. This usually follows a sequence: review the overall trend, locate accounts, inspect content, form a hypothesis, and continue monitoring. Correlation is not causation. Topic, timing, account history, campaigns, and distribution changes may all contribute. Smart BIAI Agent can use the customer's authorized social data to answer natural-language questions, summarize changes, and prepare suggested next tasks. Teams can review the accounts, period, and sources used in each analysis and return to the underlying report for details.

8. What a useful multi-platform report should retain
Even a concise report should show the data and date range, reporting time zone, account or content level, common and platform-specific metrics, official API and authorization scope, latest synchronization time, unavailable fields, comparison method, detail links, and export date and dimensions. Management can begin with platform, market, and account-group trends. Operators can continue into account and content details, while analysts retain dimensions, time, and source. They use the same data foundation without forcing every role into one overly complex dashboard. Start with one business period, one group of accounts, and one clear question. Align the time zone and metric scope, move from the overview to account and content detail, and record the next action and metric to observe.
Questions enterprise teams ask
Can TikTok, YouTube, Instagram, and Facebook data be compared directly?
They can be viewed side by side, but similarly named fields should not be assumed to have identical definitions. Fix the period and object, retain the source platform, and start with trends within the same platform or account.
Which common metrics does Smart BIAI support?
Current common metrics include followers, views, likes, comments, and shares. Viewer source and geography, plus follower gender and regional distribution, are also available where the account authorization and platform API return them.
Which TikTok-specific metrics are supported?
Within the relevant authorization scope, profile views, app downloads, website clicks, GMV, completion rate, and average watch time are supported as TikTok-specific fields.
Where does the data come from, and is authorization required?
Data comes from official platform APIs. The user must authorize an account before Smart BIAI can obtain and synchronize data within the granted scope.
How often is data refreshed?
Content published today refreshes every 30 minutes, content from the past three days every hour, content from the past seven days every three hours, and older content daily. Actual availability may still depend on the platform API and authorization status.
Can account and content data be exported?
Yes. Smart BIAI supports publishing-log exports, account- and content-level exports for the past 30 days, and custom reports by date, country, platform, account group, account tag, and video tag.
Does Smart BIAI Agent determine the true cause of a change automatically?
The Agent can summarize authorized data, suggest interpretations, and prepare follow-up tasks, but correlation does not establish causation. Teams should verify conclusions against content, market, timing, and business context.